How does the brain 'think'? Pt. III
July 26, 2024
Excerpt: In part three of a series explaining my PhD, I talk about how I might just have tracked down something in the brain that does a bit of ‘thinking’, by looking very hard at the brain when it needs to make easy and hard ‘decisions’ about where some moving dots are going.
Ideology
The brain almost certainly has many processes that contribute to any decision. Here we have one that cares about what it sees, and maybe another process that decides what to do about what it sees.
Table of Contents
filed under:
Article Status: Complete (for now).
This is part three of a series trying to explain my PhD, because people keep asking. I want to point out that my initial response to this is always “I promise that you won’t care”, but no one ever believes me. So, as a punishment, I’m going to make you read it. For three articles. You did this to yourselves.
–
In part one I pointed out that most of what humans do we probably wouldn’t consider ‘thinking’. Mostly we respond completely automatically to the world around us. It’s actually hard to find examples of ‘thinking’ that really do incontrovertably appear to be higher-order, non-routine thought. In part two, I talked about the Stroop task—trying to name the display colour of the word blue is much harder than reading the word itself, because the two tasks come into some kind of conflict. You have to overcome the automatic word-reading response which is trying to say ‘blue’ to name the colour ‘green’. As it turns out, investigating this in the brain is very troublesome.
The final thing I wanted to look at were times when the brain has to choose between competing alternatives, but not because they came into direct conflict like in the Stroop task, but maybe just times when the choices are hard to work out.
The chapters I’m about to write about have, unlike the previous part, much more about what the brain is doing. But, fair warning, interpreting what that means is not for the faint hearted.
How to find ‘decisions’ in the brain
There are a lot of situations in which the brain is trying to figure out what something is, and that thing could plausibly be other things. Maybe you’re trying to find your keys on your cluttered hall table in the dark. Or maybe you’re trying to work out if the phone ringing in the cafe is your phone or someone else’s. In these cases, you have a couple options and you have to work out which one is the right one.
There are these computational models, called ‘evidence accumulation’ models, which people like to use to model situations like this:
 An evidence-accumulation
model, called the 'Linear Ballistic Accumulator'.
An evidence-accumulation
model, called the 'Linear Ballistic Accumulator'.So, let’s pretend this image is me modelling you trying to find your keys in the dark. You have a spiky metallic object in your hand. Is it your keys? Or is it your partner’s set? This model shows me how you thought about the two options. Two plots, two options. Maybe it was your partners’ set of keys. On the left, you can see this option—the winning option. Usually, we imagine the ‘drift rate’, the arrow going diagonally, is the amount of ‘evidence’ you’ve accumulated about a decision. When it crosses the ‘decision threshold’ you’ve made a choice in favour of that option. On the left, you gathered the evidence, worked the keys in your hands, feeling the keychains, and eventually the amount of evidence you had reached the threshold. You had that ‘a-ha’ moment—it’s not your keys, it’s your partners’ set. On the right, you see the evidence you gathered that it was your keys. You never decided it was your keys. The drift rate never crossed the decision threshold. You thought it might be your keys—some evidence accumulated. The object was very key-like. But it wasn’t enough like your keys to get to the decision threshold.
So now I can see, mathematically, how the evidence about each option accumulated over time. I can see how much evidence you needed to gather before you were sure. I can get even more information out of this model. I can see, for example, how biased you were toward or against that decision (the ‘starting point’). In this case, you were assuming, at the start, that these were your keys. The start point is higher for the model on the right, the one modelling the ‘your keys’ option. But, since they weren’t actually your keys, the other model won even though it started lower. I also have some estimates of how long it just takes you to perceive things, and generate responses once you’ve decided. This is the non-decision time, at either end of the drift-rate. Fixed time associated with how long it takes you to process information in the first place, before you can use that information to make a decision.
What’s nice about these models, is that I can see if I can find this stuff in the brain. If I can find neural activity that seems to go up and hit some kind of plateau around the same time as this model drift rate hits the decision threshold, then maybe I’ve found where, in the brain, this kind of decision might be happening. Do you remember, back in my first article, that:
You can make some rough distinctions in the sciences of mind. People who say they study psychology are usually interested in how and why people behave in certain ways. People who say they study cognitive science are usually interested in how people think about stuff. And people who say they study neuroscience are usually interested in how the actual architecture works—the brain and the nervous system more broadly.
I say I study cognitive neuroscience. What we usually care about is how people think, but specifically, how the brain does it. It’s all well and good to imagine the various possible different kinds of thinking, but what we really want to know is which of these the brain can actually implement.
In this model, I can do it all. I can take your behaviour—how long it took you to decide, and close your hands around the keys. That’s psychology. I can model that mathematically, and use the model to draw some conclusions about how that meant you were thinking. That’s cognitive science. Then I can look in the brain and see if the brain was doing something like this model. That’s neuroscience. We can draw a line from the behaviour, to the mind, to the brain, and back out to behaviour again. It’s the dream.
What I wanted to do
This is actually very regularly done. People take these models and try to find where in the brain people are making their decisions. Usually, what people find is this sort of dense fronto-parietal network involved in this kind of decision process—something we’d expect because we think there is a fronto-parietal network involved in controll-y type/exective function thinking.
I wanted to do two things that people hadn’t really done yet. First, I also wanted to look at the information available in the brain about different features of the task, not just brain activity. It’s intuitive that, if you’re gathering evidence about something, then there should be more information about that evidence present in the brain. If not, then maybe you aren’t looking at the decision-making part of the brain. Maybe you’re just looking at a part of the brain where activity goes up for other reasons, like the task is hard and you’re expending effort or something.
To do that, I used a method called multivariate pattern analysis (MVPA).1 Instead of just looking at average brain activity, MVPA examines the patterns of activity across the brain.2 The primary method of doing this is known as pattern classification or ‘decoding’. Here, we use a machine learning algorithm to analyse the neuroimaging data gathered during an experimental task. So in MEG or EEG, I’d look at the amplitude of the brain waves across the different sensors on the head. To make this clear, imagine a task where participants differentiate between faces and houses. Each of my sensors might have different kinds of brain waves, and this pattern of brain waves might be different when faces are shown to when houses are shown. We’d take some trials and give them to the algorithm, telling it which trials were faces, and which were houses. The algorithm’s job is to learn to recognise the difference in activity patterns across sensors that distinguish the two. After training, we test the algorithm with trials it’s never seen before to see how accurately it can predict whether the data is from a face or house trial. The accuracy of the algorithm tells us how much information about faces or houses is present in the brain data. If it’s above chance levels, then we know there is some kind of information in the pattern of brain activity that is different between faces and houses in our brain region.3
The second thing I wanted to do was see if I could get more out of these models than the evidence about the stimulus. You’re trying to work out whether they are your keys, and these models tell me about that evidence gathering process, sure. But there are lots of decisions that are going on all at once in that process. You have the decision about whether the keys are yours or not, which is made up of little decisions about whether there are the right number of keys, or the right shape of keychain or whatever. Then you also have a decision about what to do with them if they aren’t your keys. This is all without adding whether you’re just feeling them, or if you’re also peering at them, or jingling them to see if they sound right. Because now you have all these other decisions too—visual decisions, auditory decisions. So, my question is, are these models only good to measure these decisions all together as one big decision? Or can we use these models to get at all the minutia of the decision making process–this cascade of decisions from perception to action.
What I did
The best task for this kind of thing is a dot-motion task. You have a field of randomly moving dots, and some proportion of them are all moving together in one direction. The more dots are moving in one direction together, the easier it is to tell what direction they’re moving.
These tasks are good because it’s hard to imagine how you solve a motion task without gathering evidence over time about the motion. You need to see the thing move moment by moment to tell it’s moving. But lots of other decisions might not be true evidence gathering. You could imagine with the keys, you’re not evidence gathering so much as looking for one piece of information that will tell you it’s your keys. Does it have your keychain? Yes or no. Yours or not. It’s not a slow process of accumulation.
So I used one of these dot-motion tasks. I had two conditions—whether the dots
were easy or hard to see—whether there were more or less moving all together
in one direction. We’d expect that, when the dots are hard to see, you’ll
gather evidence more slowly, your drift rate is slower, and I should find
activity in fronto-parietal regions that correspond to this. The reverse when
the dots are easy to see.
That is the normal thing people do. But I wanted to do more than the normal thing people do, so I added two more conditions. Here the actual direction the dots were moving in would be easier or harder to categorise:
 The directions of coherent dot motion.
So the idea is to categorise the dots as moving more towards the red dot, or more towards the blue dot. If the dots are moving directly towards the red or blue dot, then it’s easy to categorise. If the dots are moving somewhere between the red and blue dots, it’s harder to tell whether it should be a red dot or a blue dot trial.
We end up with trials where the dots are easy or hard to see, and the dot direction is easy or hard to categorise, and I essentially wanted to know:
- Does the brain do something different when it’s hard to make a decision because you can’t see what’s going on properly, versus when it’s hard to make a decision because even though you can see what’s going on, the correct decision isn’t clear?
- Are there differences in the kind of information about the decision available to the brain across these two things?
Either of these things seem like they could tell me a little more about what the brain is doing when it makes decisions.
What I found
I certainly got some pretty plots out of this. Here, I’m plotting a group of sensors on the top of my participants’ heads:
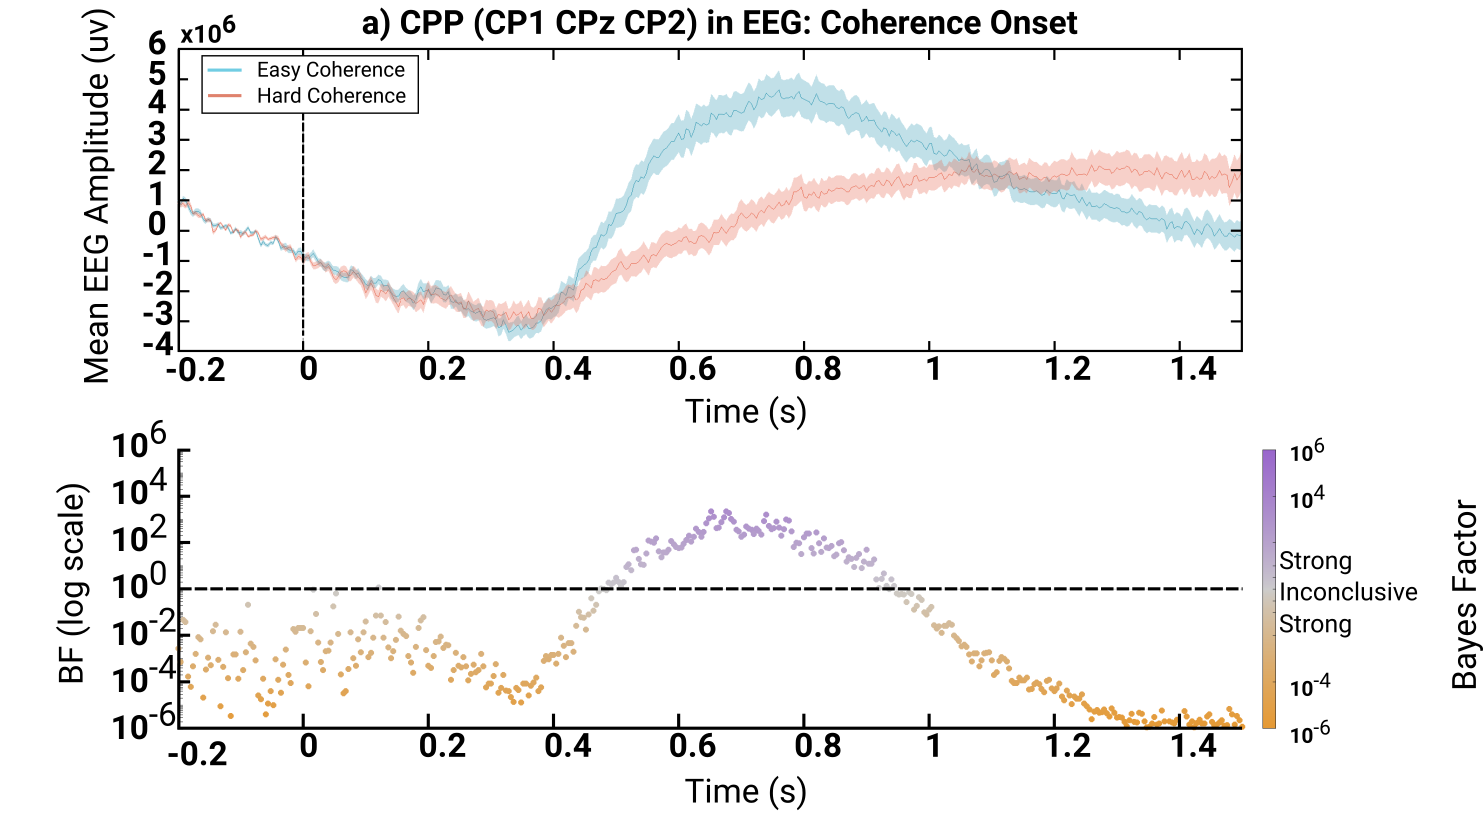 The top plot is the brain activity when dots are easy to see (blue) versus hard to
see (red). You can see when this region of the brain finally received the word that
it was supposed to do something---about 400ms in. The bottom plot is the
Bayesian evidence (basically the strength of evidence) for whether there's a
difference. If the dots are clustered below the dotted line, there is a
strong probability that no difference between the lines exist. If the dots
are clustered above, there is a strong probability there is a difference.
The top plot is the brain activity when dots are easy to see (blue) versus hard to
see (red). You can see when this region of the brain finally received the word that
it was supposed to do something---about 400ms in. The bottom plot is the
Bayesian evidence (basically the strength of evidence) for whether there's a
difference. If the dots are clustered below the dotted line, there is a
strong probability that no difference between the lines exist. If the dots
are clustered above, there is a strong probability there is a difference.
Here, we can see the difference in the brain between trials where the dots are easy versus hard to see. As we basically expect, when the dots are easy to see you get brain activity that shoots up faster and peaks higher when the dots are hard to see. We expect this because when the dots are easier to see, there is more evidence available, so we’d expect the brain activity to be stronger. This is what everyone else finds, so we’re happy we found this too or we’d be wondering if we messed something up.
But what about when the actual decision itself is hard to make?
The top plot shows the difference
between when categorising the dots is easier (blue) or harder (red) to
do. In this case there's very little difference between the two. The Bayesian
evidence (strength of evidence) also stays below the dotted line---there's
always a strong probability that there is no difference in brain activity.Here we see something different. Visually the brain activity looks a little different when the decision is harder to make than when it’s easier, but when we test that difference, the analysis strongly thinks they aren’t different. And when I look around the whole brain, rather than just these sensors at the top of the head, I find that there isn’t really a difference in the strength of brain activity anywhere:
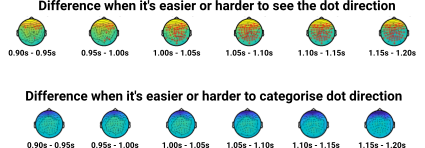 These are topographic plots of the
difference in brain activity over time. The darker the blue, or the redder it
gets, the more difference there is. But what we really want to see is the red
stars---these are statistically significant differences between sensors
across the head. There are lots of red stars when dots are easy to see vs
hard to see, but none when dot direction is easy to categorise vs hard to
categorise.
These are topographic plots of the
difference in brain activity over time. The darker the blue, or the redder it
gets, the more difference there is. But what we really want to see is the red
stars---these are statistically significant differences between sensors
across the head. There are lots of red stars when dots are easy to see vs
hard to see, but none when dot direction is easy to categorise vs hard to
categorise.Now, it’s important to point out that behaviourally, both of these difficulty manipulations make participants slower and more error-prone. So we probably should see something, although it’s always possible that the brain scanner isn’t strong enough to see it.
There’s one other thing we can look at, the frequency of the brain waves, rather than just the overall strength of them. And here, we finally see a difference. It’s pretty normal to see a pattern in the beta-range of frequencies where neural activity becomes less synchronised before a response and more synchronised afterwards. It’s usually thought to be a motor preparation signal—the brain getting ready to respond. In my case, this was stronger when dots were easier to see than when it was harder. Makes sense—if you can see the dots more easily, you can get ready to respond more quickly.
But when the decision was harder to make versus easier to make, I actually saw the opposite—more synchronisation when it was easier, not desynchronisation as we would expect. This is kind of interesting. As I mentioned, more commonly the brain desynchronises more in the beta range before a response when it’s easier, just like my manipulation with the dots. We’d probably take this to mean that whatever brain mechanisms produce this frequency of brain waves are less and less involved are you get ready to respond—you’ve already worked out what you need to do, so these regions are turning off, something like that. So, in this case, maybe these brain mechanisms are more involved when it’s harder to make a decision. This also makes sense.
To better understand this, we can ask what kind of information is available about the task in the brain, and whether it differed across my conditions. So if dots are easier to see, you’d expect to see more information about the dots available in the brain than when dots are harder to see.
And we do! I saw more information about the dots when the dots were easier to see. I also saw more information about which direction the participants were supposed to categorise the dots as (i.e. could I decode from the brain whether the brain knew if the dots going more towards the red side or the blue side).
But, when I looked at times when the decision to categorise the dots was easier or harder to make I did not see a difference in the amount of information about the dots available in the brain. I only saw a difference in the information about what direction the dots needed to be categorised as (i.e. I could decode if the brain was supposed to be making a red or blue decision).
The last thing we can look at is the parameters of the evidence accumulation model. Remember the parameters can tell us about what’s going on in their head. The decision threshold tells us how much evidence they needed to gather. The drift rate tells us how fast they gathered the evidence. In this case, the drift rate was faster when dots were easier to see—they gathered evidence faster—and the decision threshold was higher when the decision was harder to make—they needed more evidence.
What these two things tell me is that we have two distinct processes going on here. One that relies on the perceptual information—what’s coming in through the eyes—to inform decision-making. This isn’t that surprising. The decision is about what’s coming in through the eyes, so it makes sense that something in the brain would care about it.
What’s interesting is that there seems to be a different process here that doesn’t care about what’s coming in through the eyes, but still does influence the decision process. It seems like it’s waiting for the first process to do its thing before contributing to the decision—something later, and maybe more evaluative in nature.
Outro
I’ll be impressed if you made it this far. I got bored even typing it out, and certainly I could re-do the figures rather than cropping them badly from the thesis itself. But for you, I will recap.
Lots of decisions require us to ‘think’—to deliberate between a couple of options to work out which option is the best or correct one. But like any ‘higher-order’ brain function, we really don’t know how such a thing would happen. What, in the brain, can ‘choose’ among options?
Here, it looks like we might have gotten a little closer to finding something. There’s one process here that seems like it’s figuring out the direction of the dots—it cares about how easy and hard the dots are to see, and we can see that the brain here is behaving in ways we would expect when that is influencing the response of the person.
But there is another process that doesn’t really care so much about the dots, and it’s influencing different kinds of brain activity. Here, we might be looking at something that’s more evaluative, something that might be deciding what to do once you’ve figured out what direction the dots are moving in.
It’s a small step, but it’s a step.
I’m about to say basically the same thing I said in the last article, but using brain waves and not fMRI. You can read it again, or skip it. ↩
For the technically minded masochist, you could check out a pretty good tutorial in Grootswagers, T., Wardle, S. G., et al. (2017), Decoding Dynamic Brain Patterns from Evoked Responses: A Tutorial on Multivariate Pattern Analysis Applied to Time Series Neuroimaging Data. ↩
There is another method for MVPA called Representational (dis)Similarity Analysis (RSA). I actually used this method, but I’m not going to try and explain in text. It was hard enough in my PhD. The technicalities aren’t really that relevant, and it essentially produces the same thing—a metric of how much information about a stimulus is present in the neural activity of a given brain region. For this article, I’m just going to refer to it as decoding (even though that’s not technically correct). ↩
Ideologies worth choosing at btrmt.
search
Start typing to search content...
My search finds related ideas, not just keywords.